21. Services Health Dashboard - Lightweight and feature rich dashboard for your services and applications
While I worked at Google during the publishing of this post / video, the views expressed here are my own and may not reflect those of my employer. Only publicly available material is used to put together the content of this article and video. The website and the Youtube videos are NOT monetized.
If you run / manage applications and services for your customers, it is quite important that you keep them updated about the status of these services and applications.
Services Dashboard is an application that provides you / your organization following functionality
- Display the status of the services you manage for your customers
- Allow access to your dashboard publicly or to selected customers
- Update the status of your services manually or via API integration / automation
- Notify your customers about the status changes via email
- Show history of service status
💡 So if those are not your goals, you can skip this post. But if you want to find out more, here’s what we are covering in this post.
- What’s Services Dashboard ? - covered above.
- Services Dashboard functionality demo
- Documentation
- Setup and configuration steps
Services dashboard functionality demo
Let’s start with the demo of what Services Dashboard can do for you / your organization.
Please watch in full screen or on YouTube directly
Documentation
It is highly recommended that you checkout the functionality demo above 👆 before delving deep into the architecture and rest of the documentation below
1. Architecture
The application is designed to so that it can be deployed very quickly (~20 minutes) with minimal number of GCP services (check setup steps for more) for simplicity and cost effectiveness. Following diagram shows the overall architecture
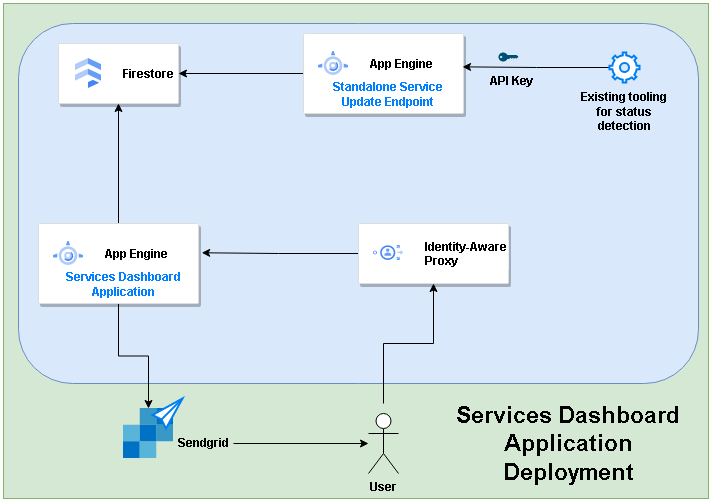
- The application has two parts
- Online (display, update and notify service statuses)
- API Endpoint (optional - if you want to update the service statuses automatically)
- Both parts are served by same codebase but separate application engine service deployment
- There are following distinct functionalities that the application offers
- Dashboard
- Add Service
- Search and update Service
- View service status history
- View recent notifications
- Notify service status updates via emails
- Update application wide settings
- Help
- The login to the application is managed with Identity Aware Proxy so no separate user management is needed.
So, let’s look at the functionality screen by screen
The application allows 2 types of users Admins that can add and update the services and everyone else (non admins) that can view the dashboard and service history. Please check setup steps for more details.
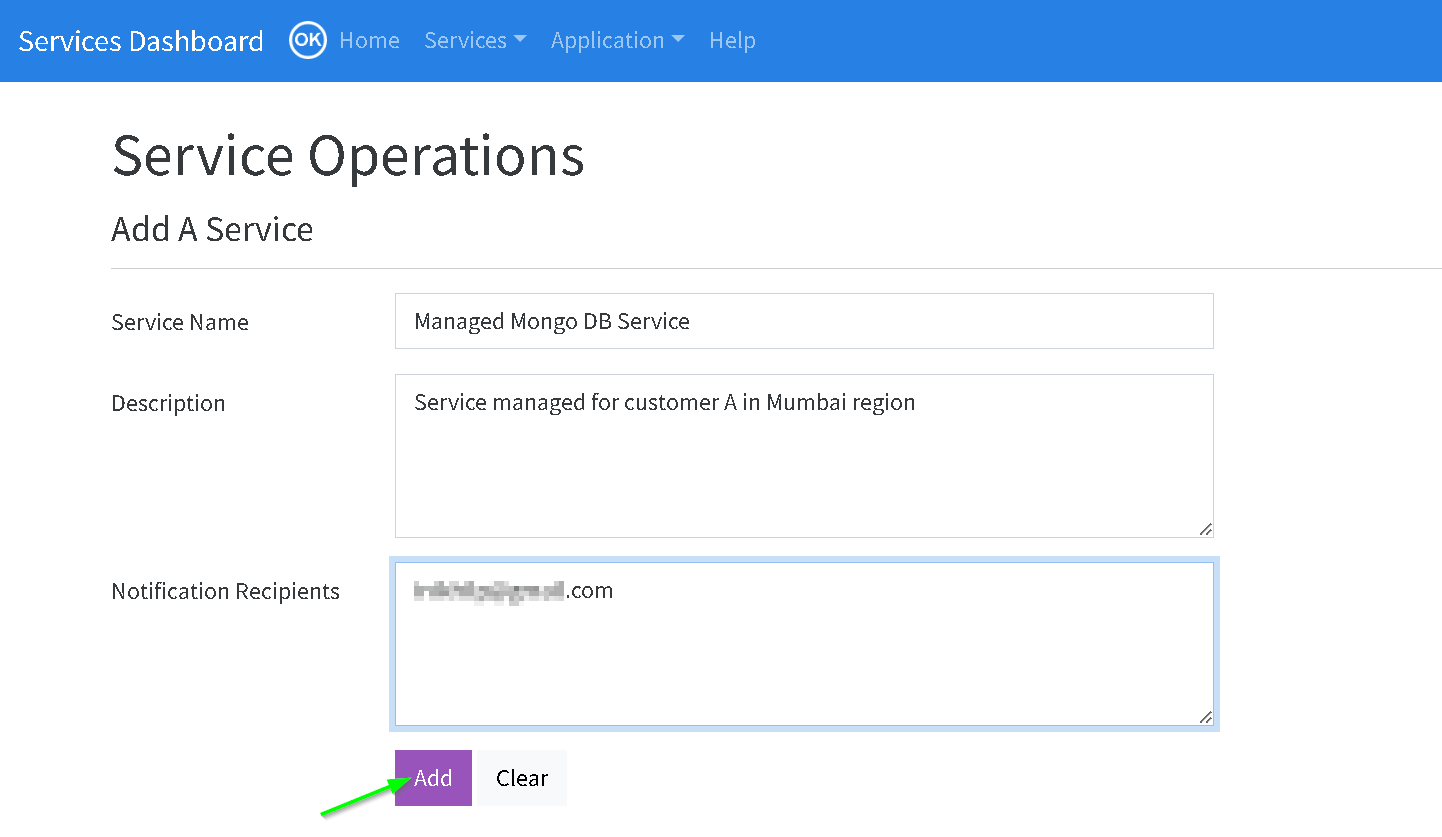
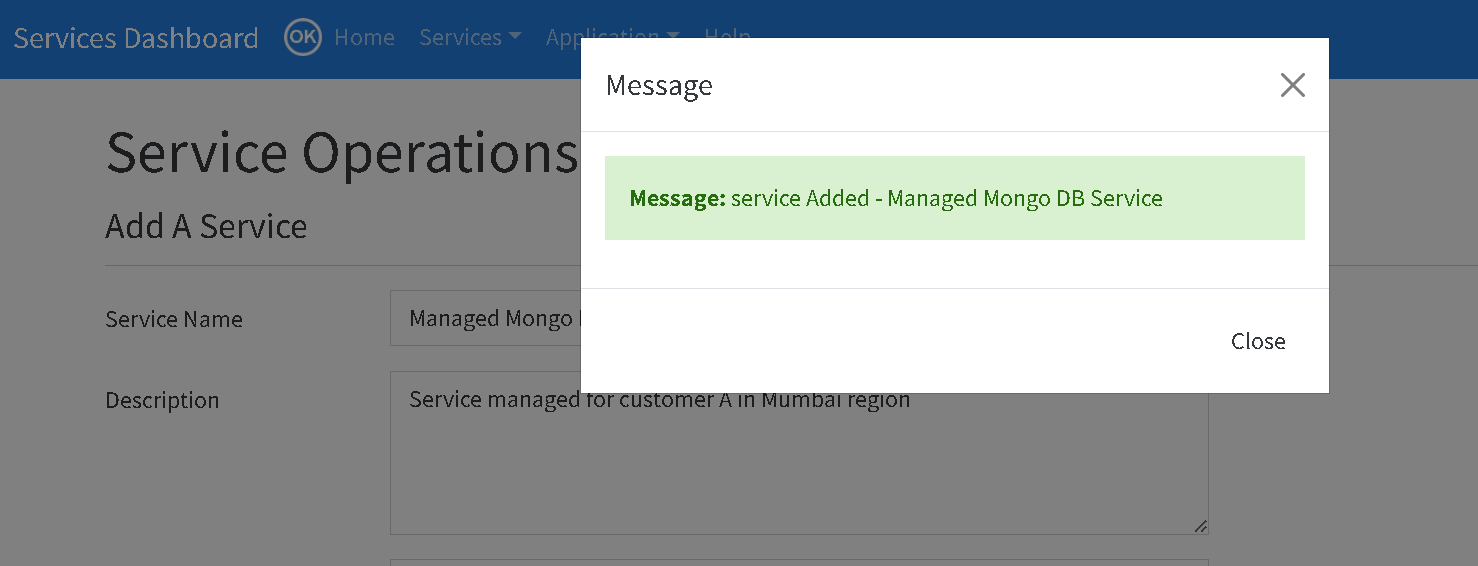
2. Add a Service (admin)
You can add a service / application that you manage using this screen. Navigate to Services -> Add A Service
Here are the screenshots
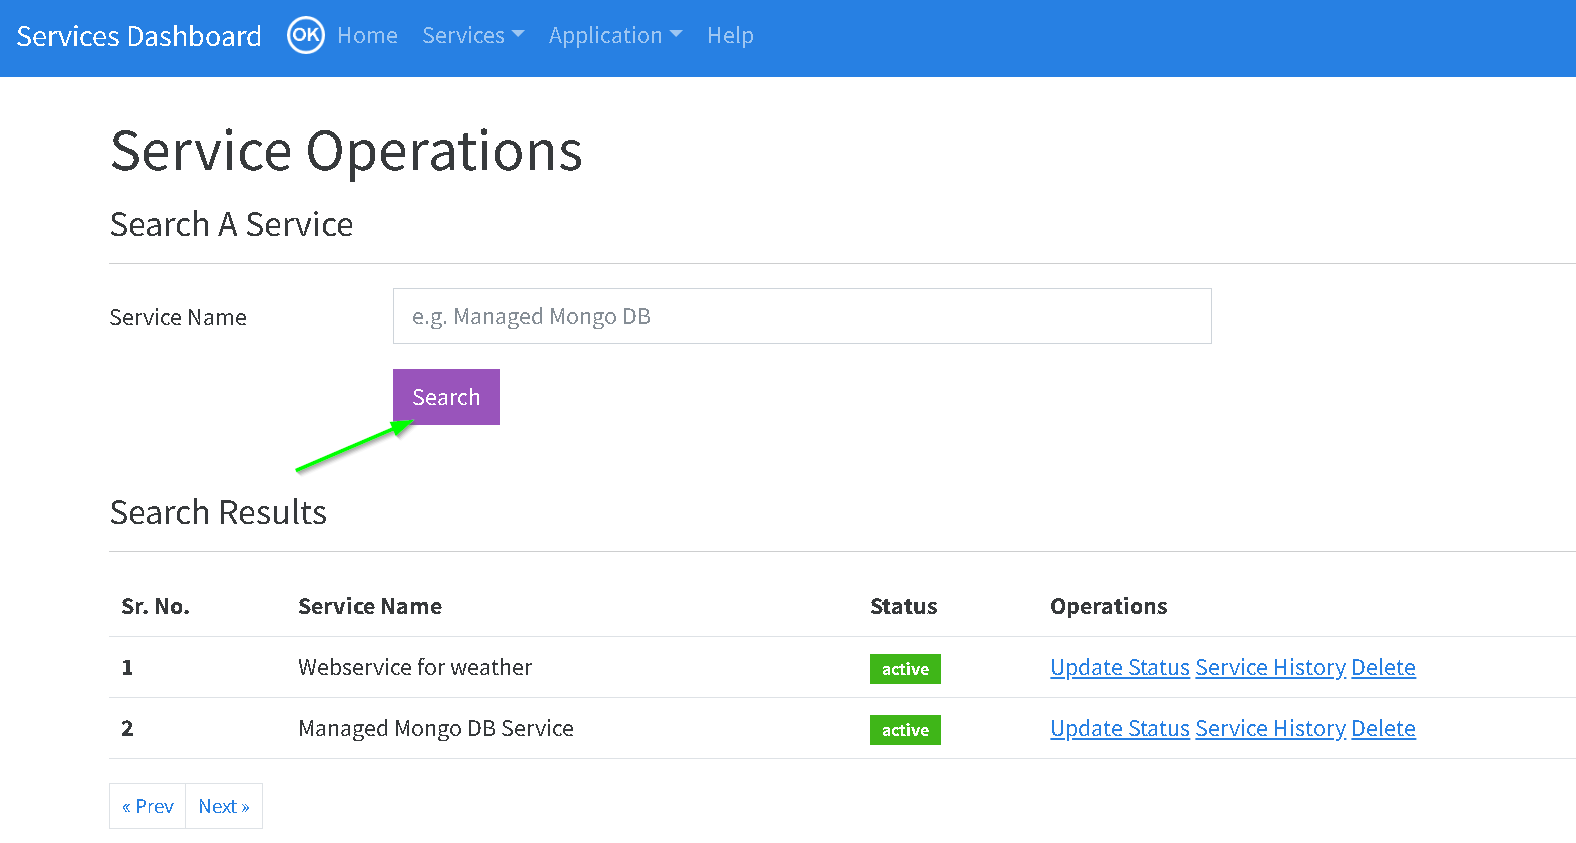
3. Search services (admin)
You can search for a service or all services and perform following operations
- Update service
- View history
- Delete service
Services -> Service Operations
Here are the screenshots for searching the service
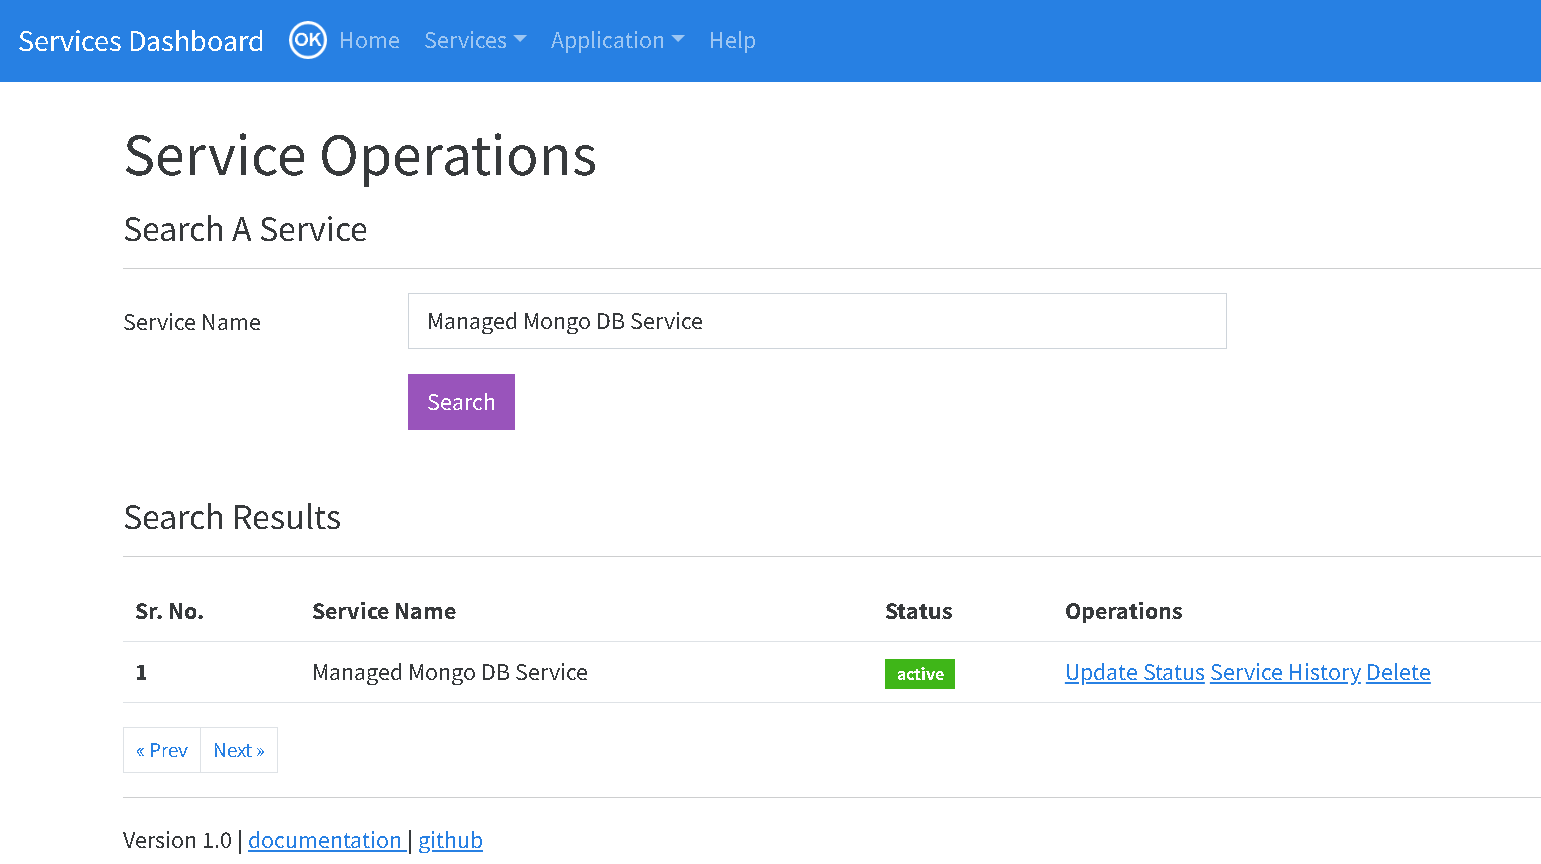
You can search for a specific service as well
4. Update A Service (admin)
If the status of the service has changed you can click the Update Status in the search screen and update it as shown below
Here are the screenshots. We are changing the status of the service.
You can update other elements of the service as well
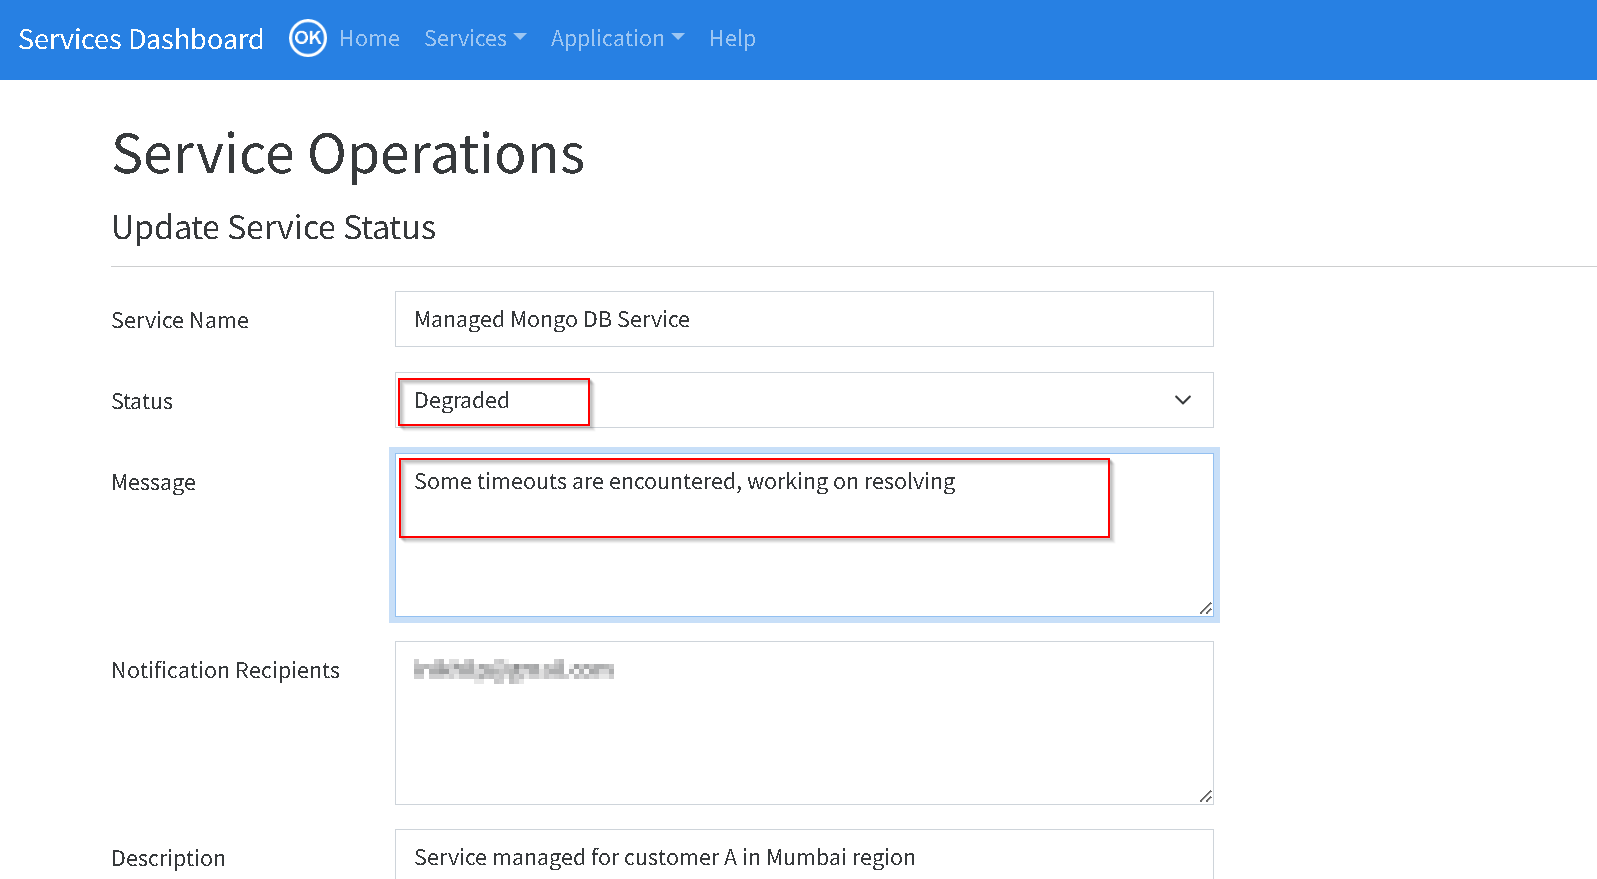
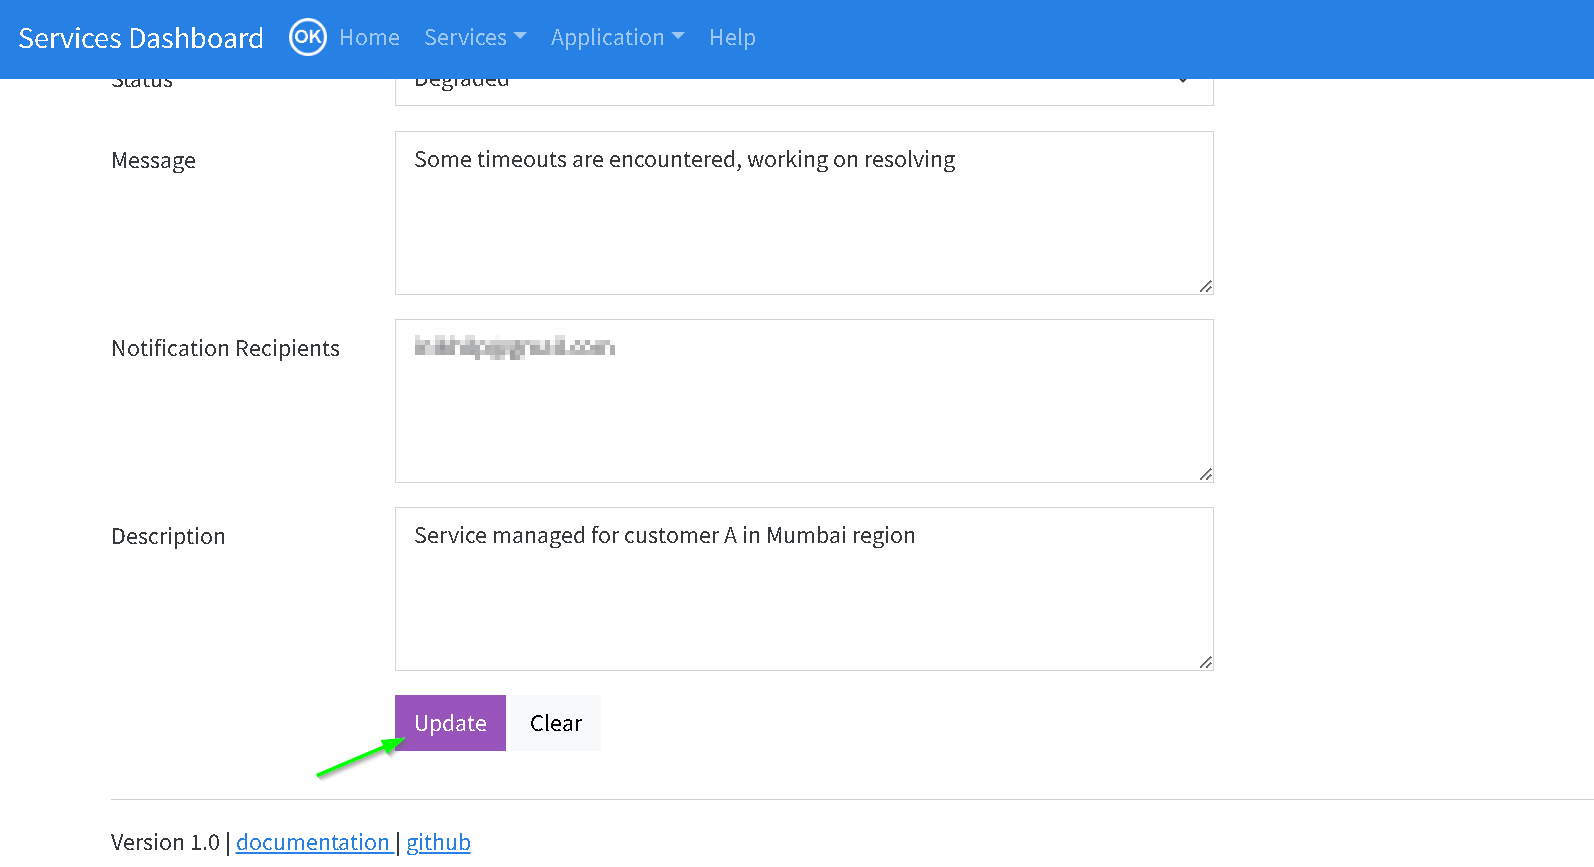
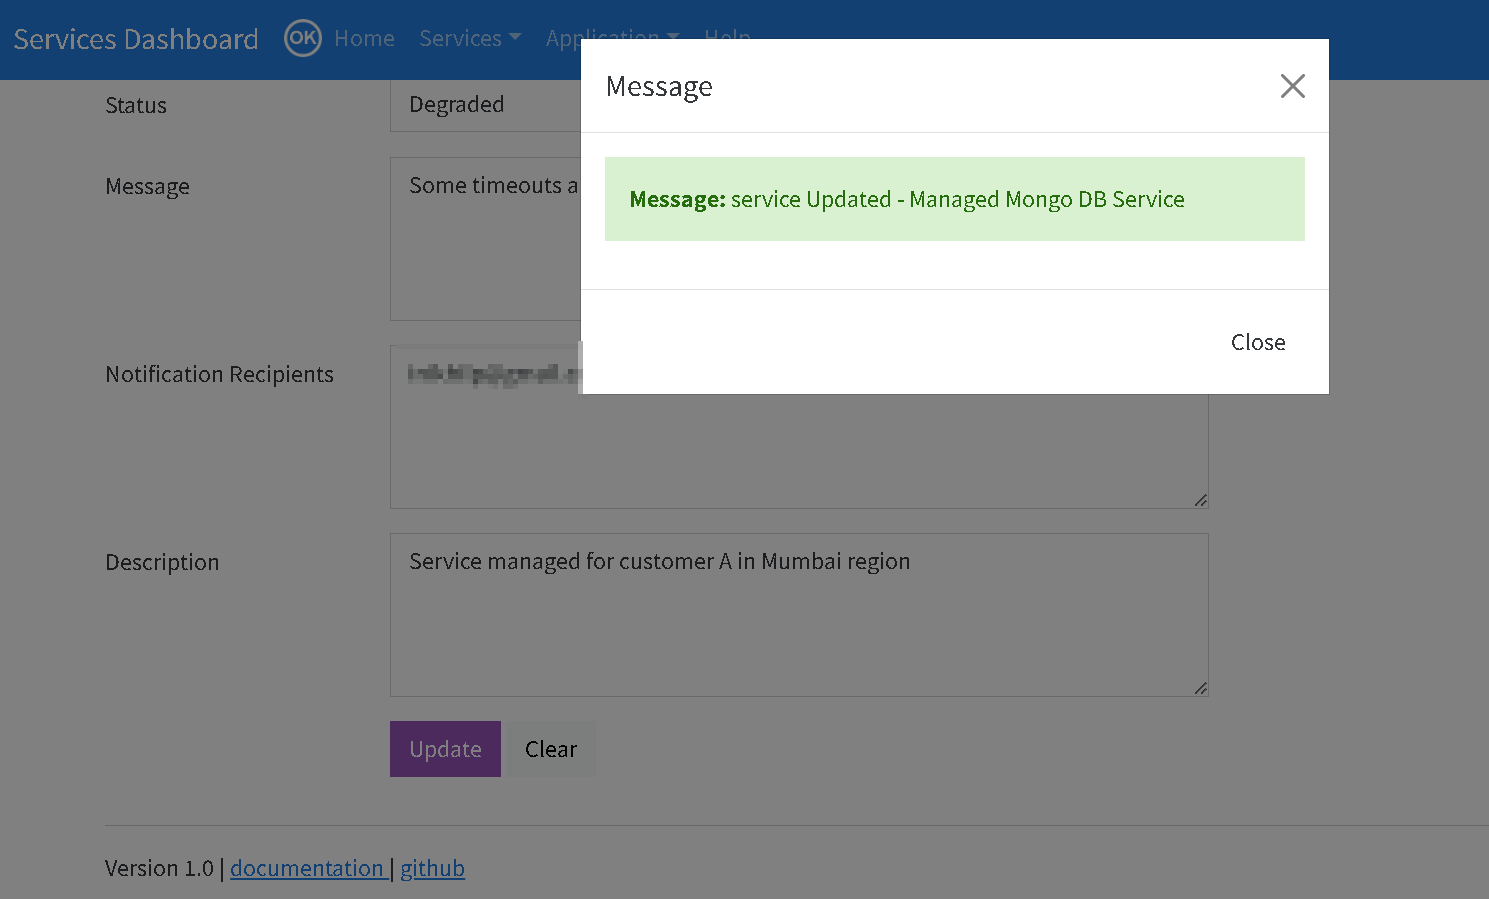
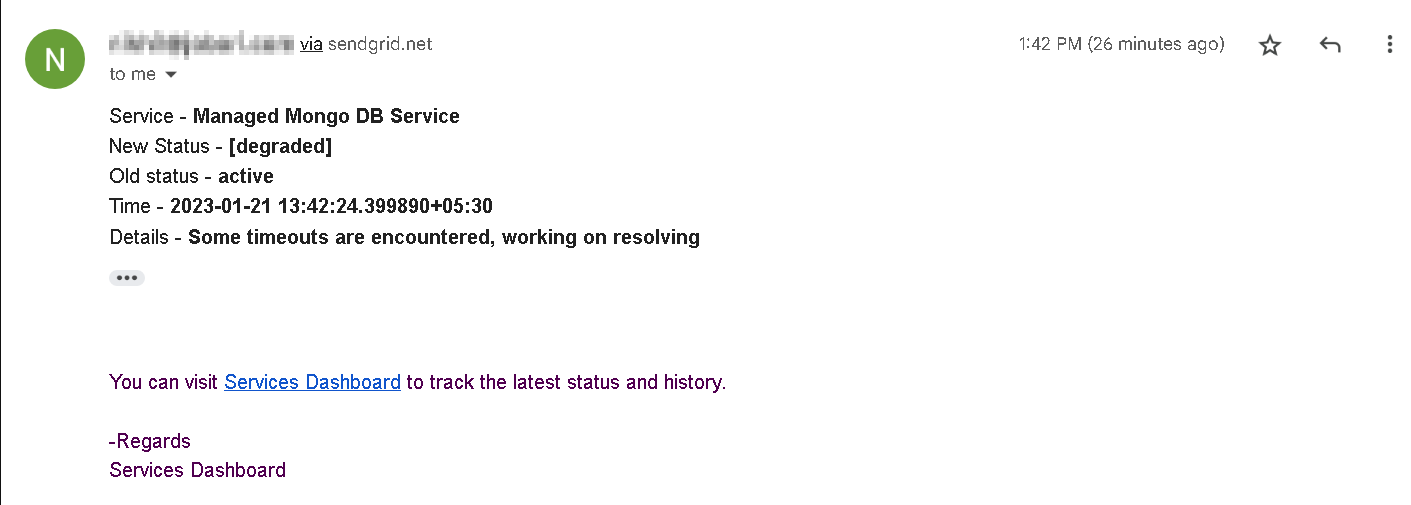
Updating status also triggers a notification
You can refer setup steps for setting up notifications.
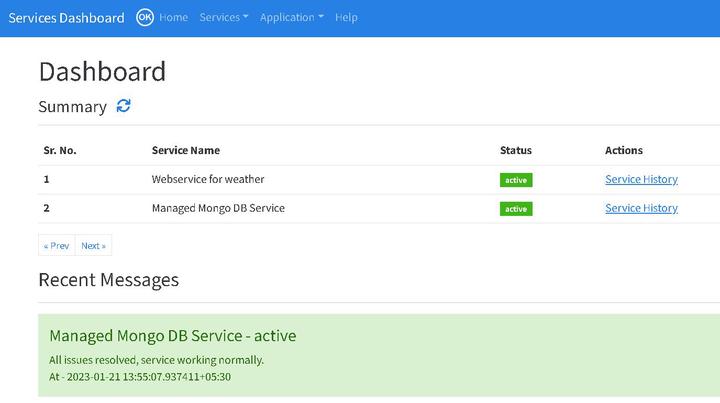
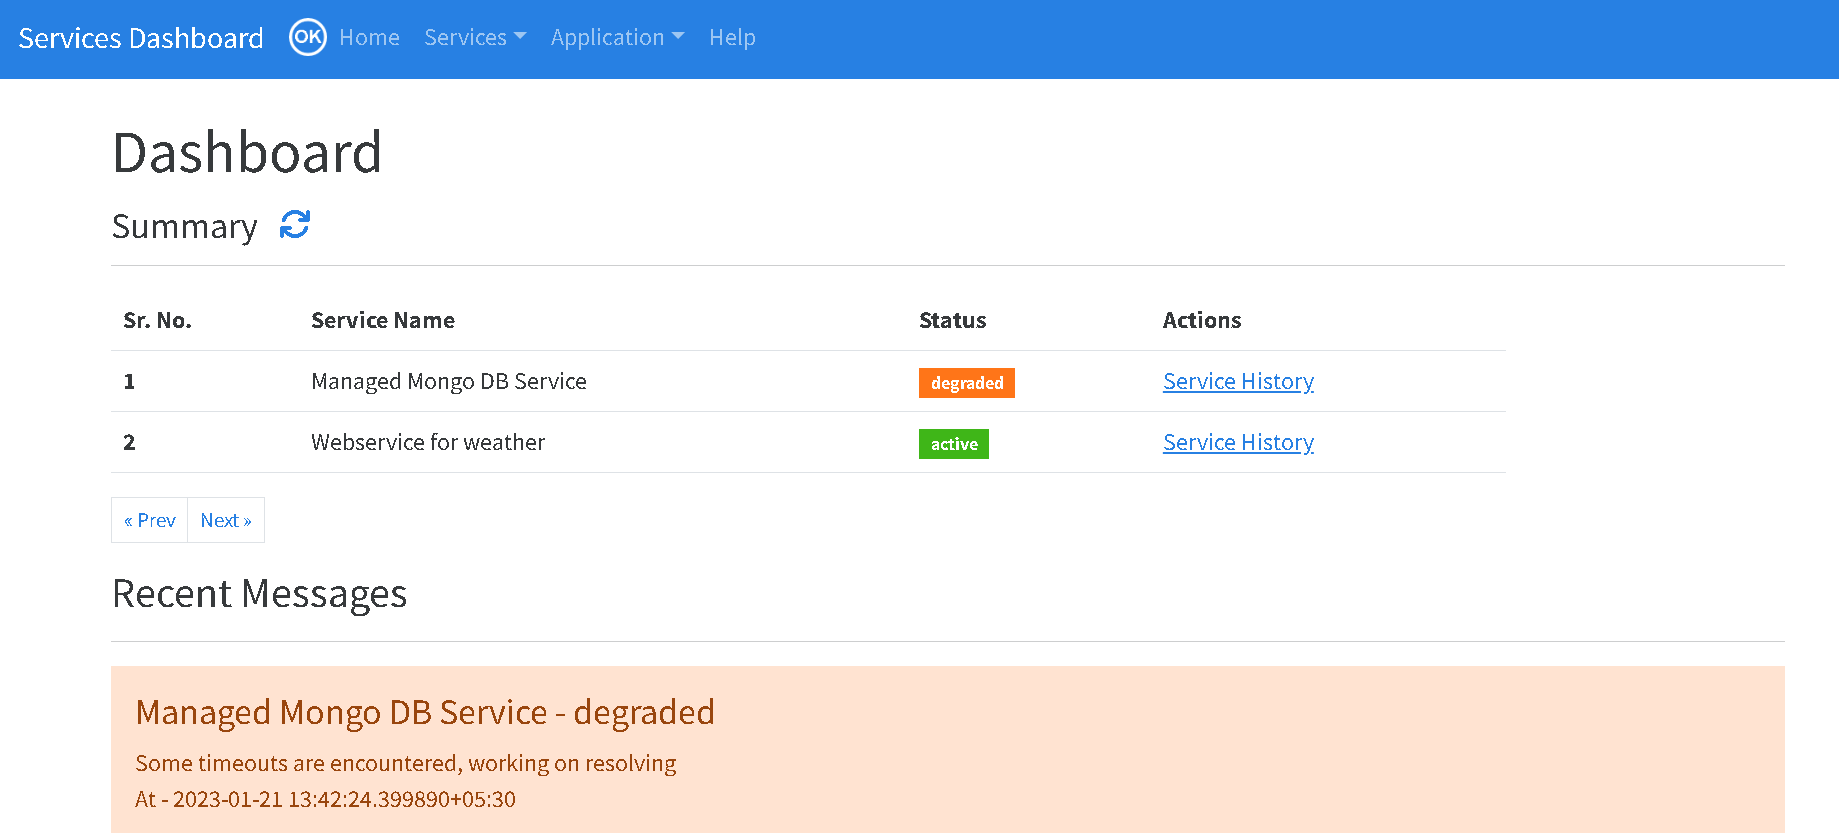
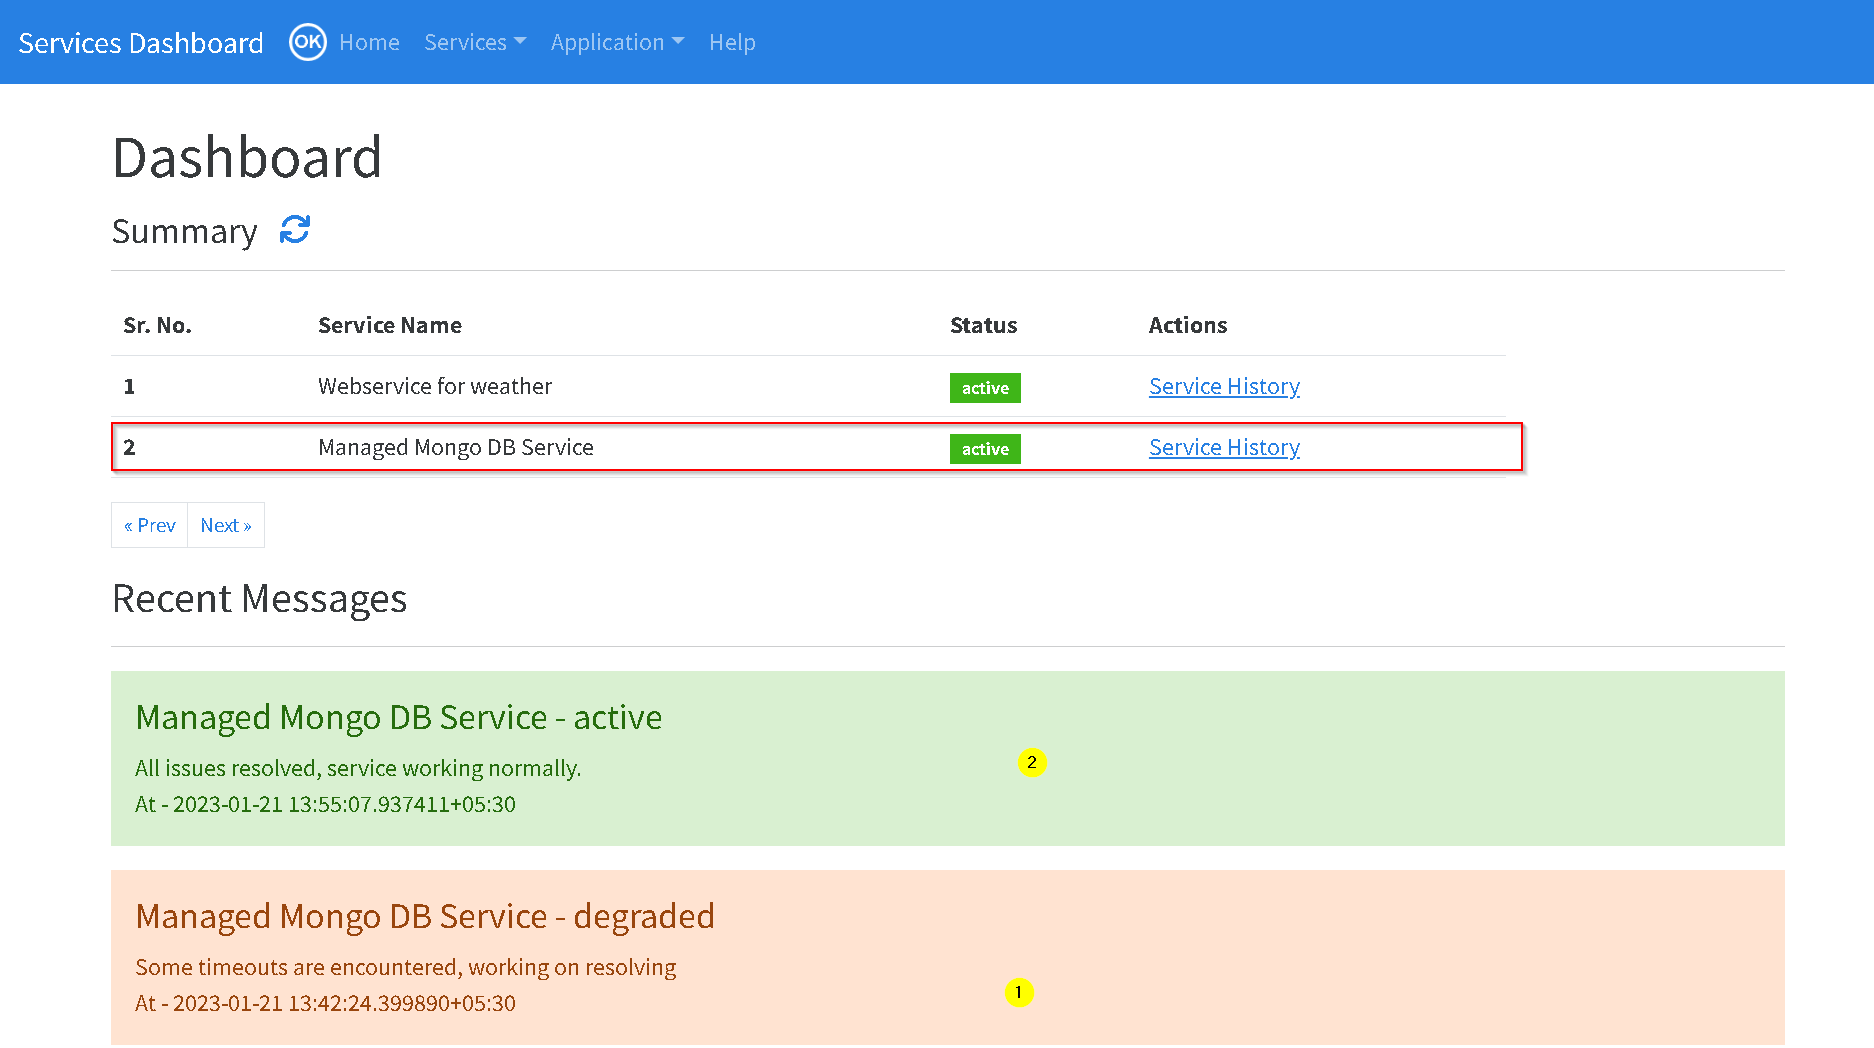
5. Dashboard / Landing page (everyone)
Now that we have added services and updated the status
- Summary (you can refresh that with the 🔁 icon) - This shows services and their statuses
- Recent notification messages
Here are the screenshots
please check the video for detailed functionality demo
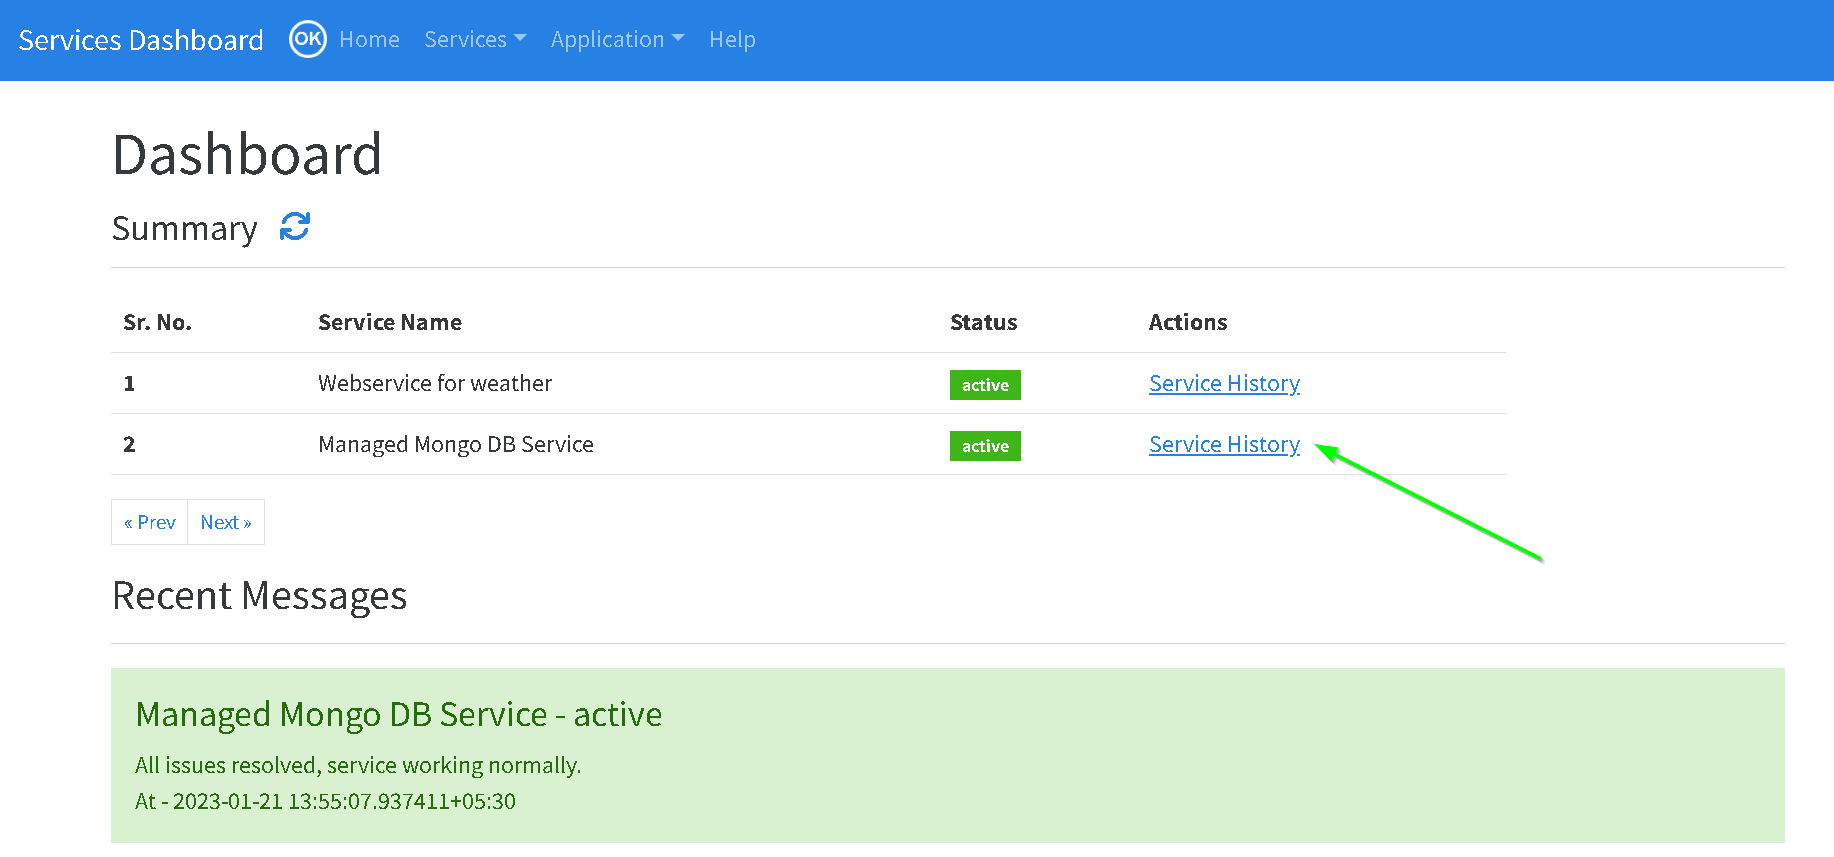
Now let’s update the status of the service again to active. This should send another email as shown below and also you can use the refresh icon on the dashboard for latest status.
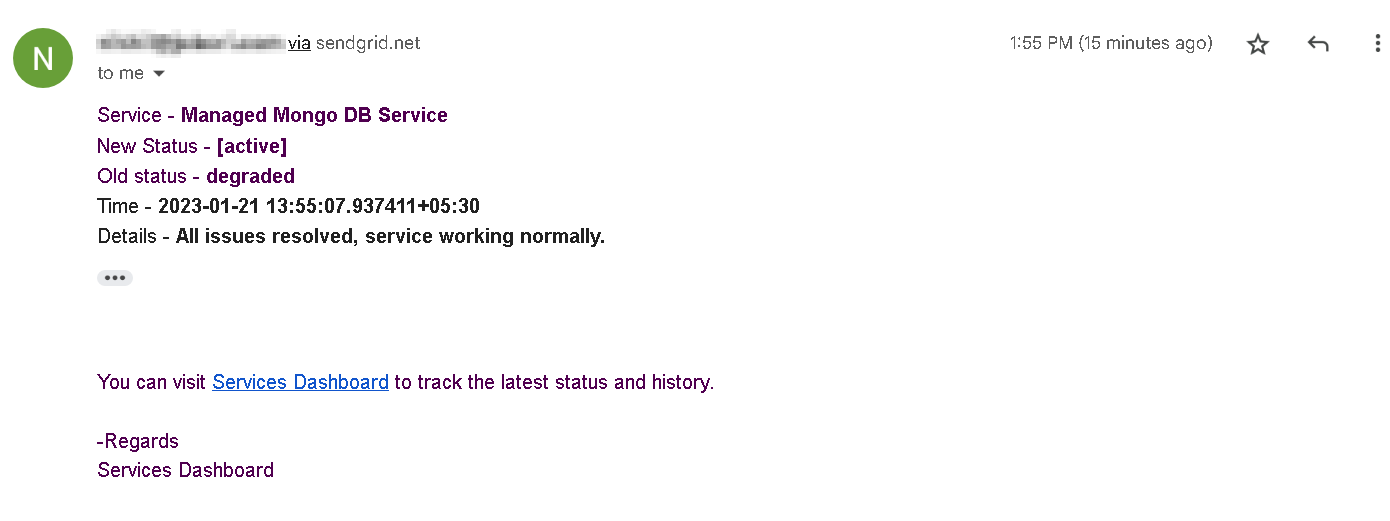
Refreshing the dashboard shows the latest status and also the recent messages.
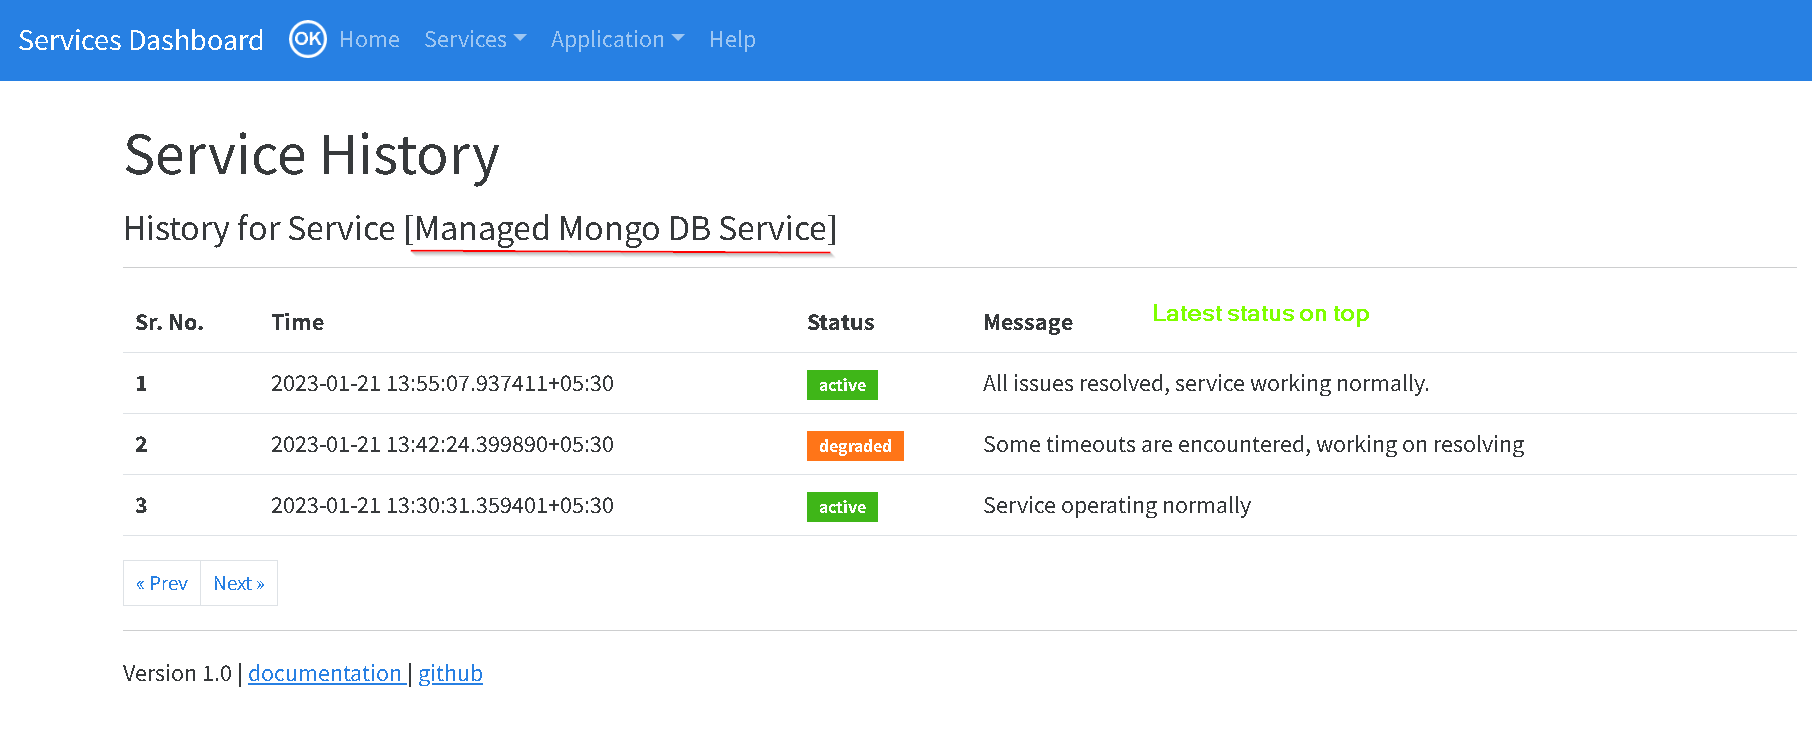
6. Service history (everyone)
You can view history either from dashboard or from services operations page. Service operations page is only available to admins.
Here are the screenshots
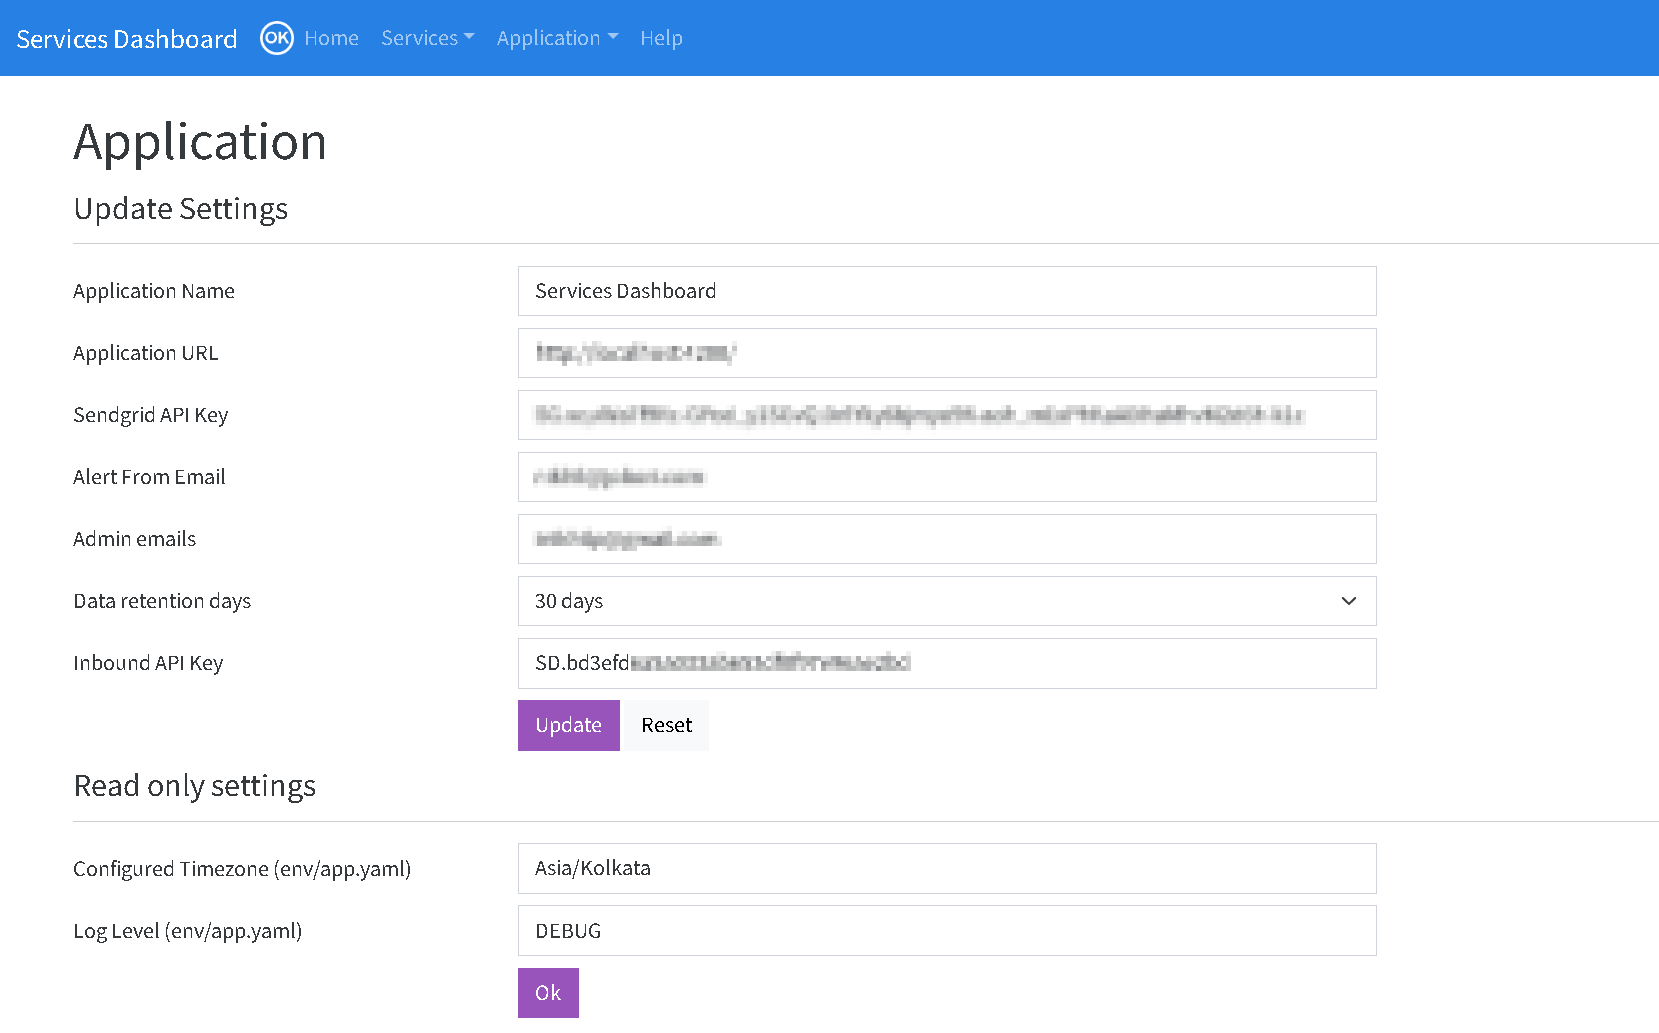
7. Update settings (admin)
This menu allows you to view and change application wide settings. There are two sections. The settings that can be changed and those that are read only (which are retrieved from environment / configuration files)
⚠ If you update the settings - it can take up to 5 minutes for these changes to take effect.
Following table explains these settings
| Sr. No. | Setting | Read Only | Mandatory | Description |
|---|---|---|---|---|
| 1. | Application Name | No | Yes | You can change it according to your preference. It will show up on the Navigation bar and alert emails as such. |
| 2. | Application URL | No | No | Is used to direct user back to application in the alert email |
| 3. | Sendgrid API Key | No | No | API Key for Sendgrid subscription used for sending alert emails |
| 4. | Alert From Email Id | No | No | Should be same as the email id in the Sendgrid subscription |
| 5. | Admin emails | No | No | Users that can update the application and settings |
| 6. | Data retention days | No | Yes | How long to retain the data created by the application |
| 7. | Inbound API Key | No | No | API keys for Separate API for updating statuses. Please check the Automating Service status updates for more details. |
| 8. | Configured Timezone (env/app.yaml) | Yes | NA | Comes from app.yaml. Check setup steps for more |
| 9. | Log Level (env/app.yaml) | Yes | NA | Comes from app.yaml. Check setup steps for more |
Here are the screenshots
8. Automating Service status updates (via API key)
This is an optional functionality, use it if you have existing processes to automatically update the service status. This relieves your admins from updating the service status manually.
If you have an existing tooling setup that can update the status of your services automatically you can use that to send status update on a REST endpoint. This REST endpoint is secured by the API key (from the settings screen above).
Please check the Architecture diagram and setup steps for more on this.
Functionality Demo also shows this functionality.
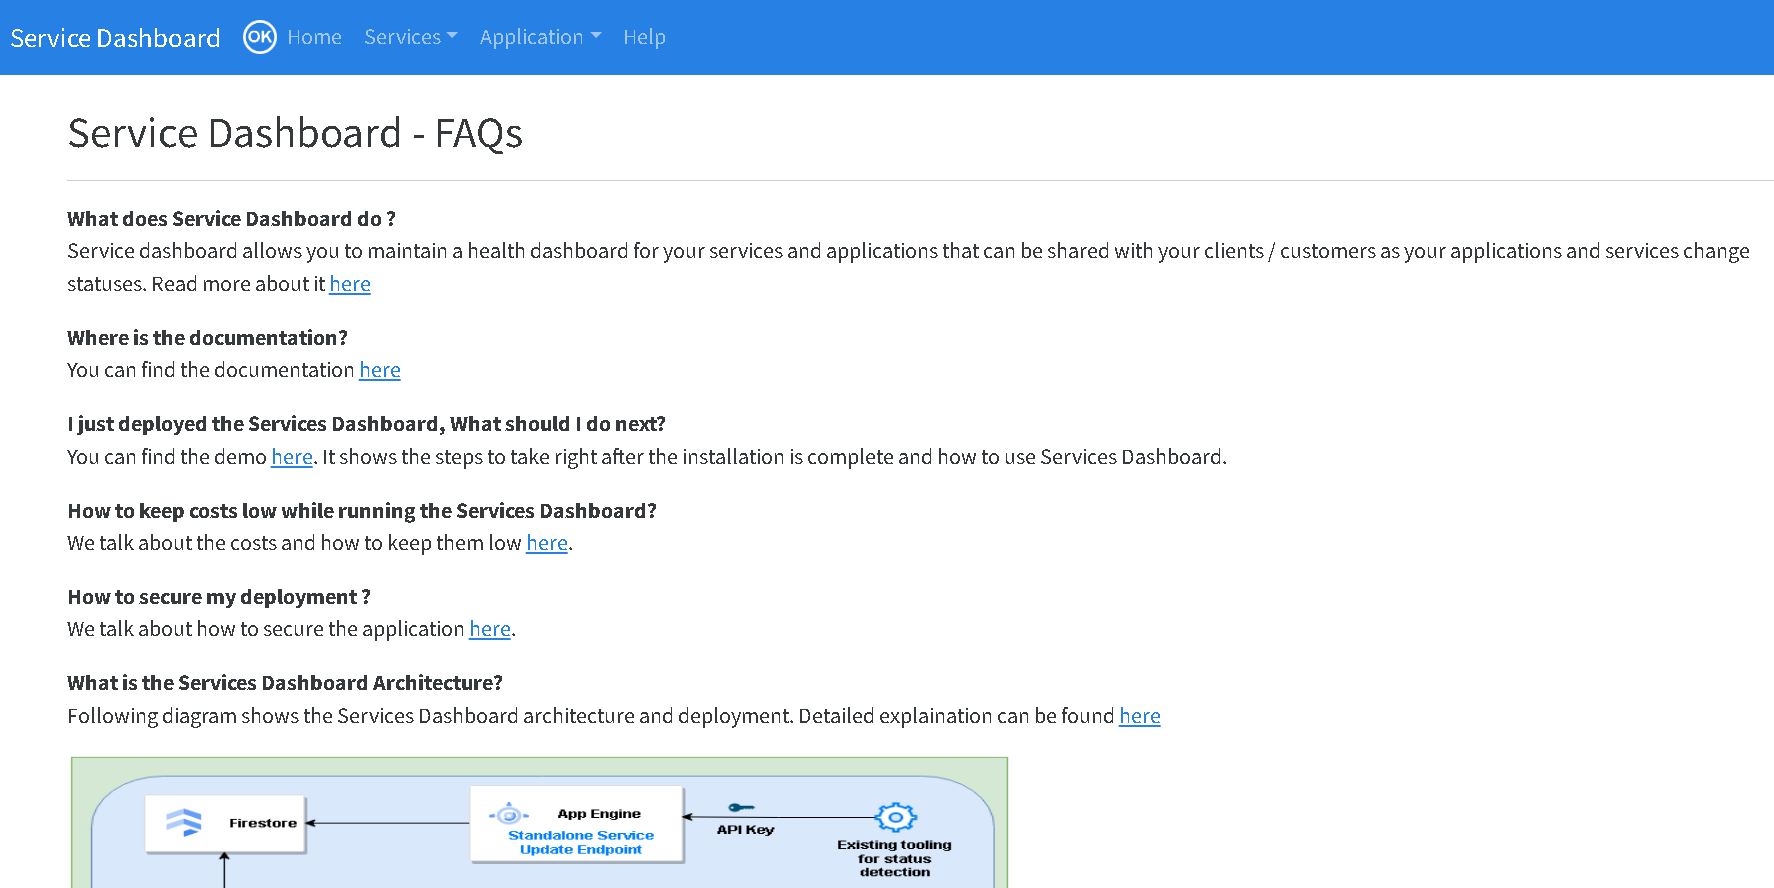
9. Help (everyone)
Help menu has some FAQs most of which lead to this documentation.
10. Costs
Running Services Dashboard in default configuration should be sufficient for most use cases. In default configuration Services Dashboard runs in Free Tier limits for the most part. But if you have more than 20 concurrent UI users please check improving performance section below.
One has to consider following services when it comes to costs
- App Engine
- Cloud Datastore (Firestore)
- Identity aware proxy (IAP)
- Cloud logging
- Sendgrid
In the default configuration Services Dashboard runs using a free tier F1 instance (free tier eligible) and keeps the reads and writes to Firestore within the free tier.
IAP is available at no charge from Google cloud.
For cloud logging pricing please check here. But, generally Services Dashboard logs should not add to costs drastically if standard retention settings are used.
Services Dashboard uses Firestore as its database. Again with our example above and assuming you do not have a lot of UI users, you should comfortably run Services Dashboard in free tier of Firestore as well. Please check Firestore pricing for more details.
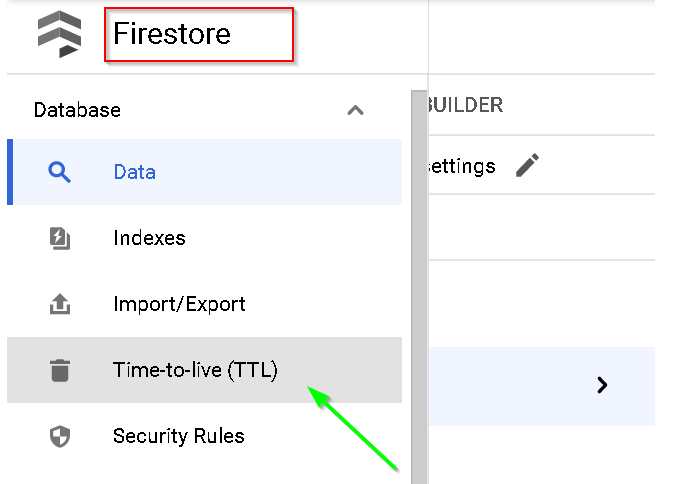
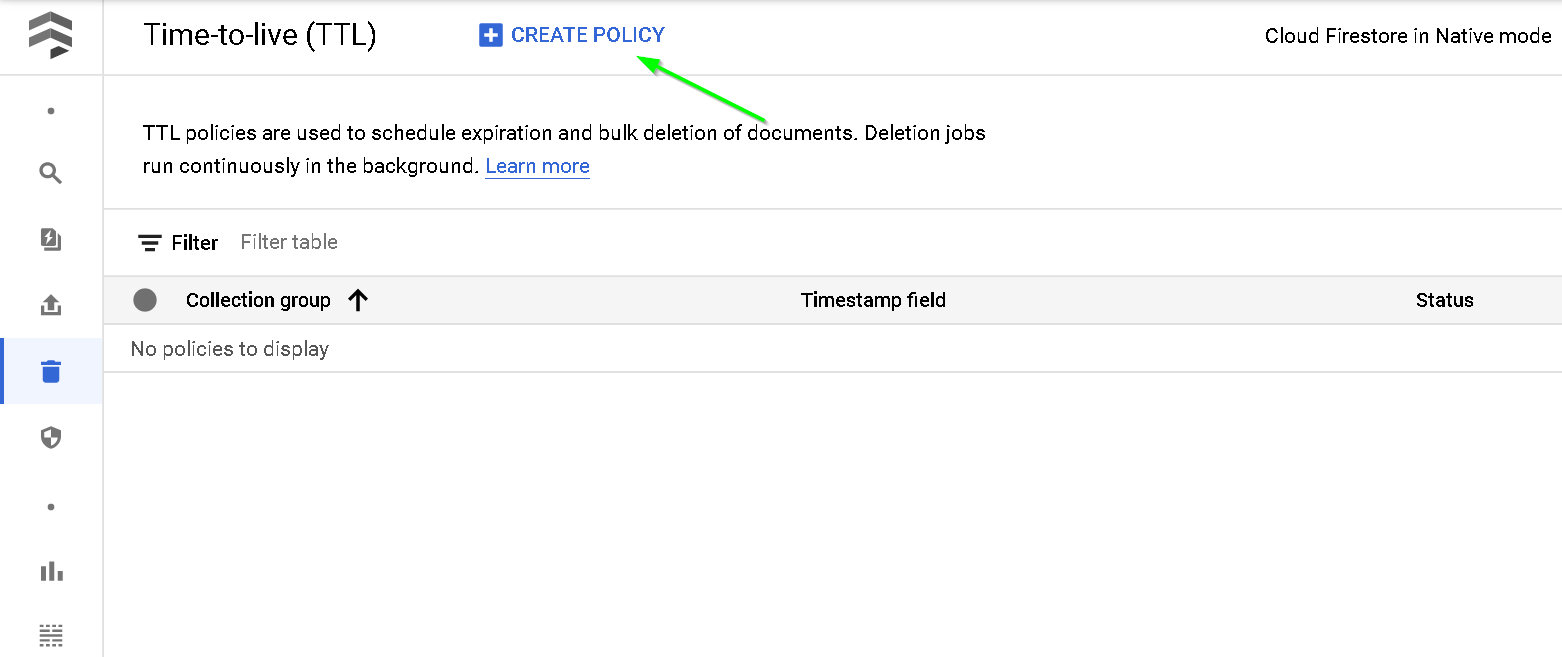
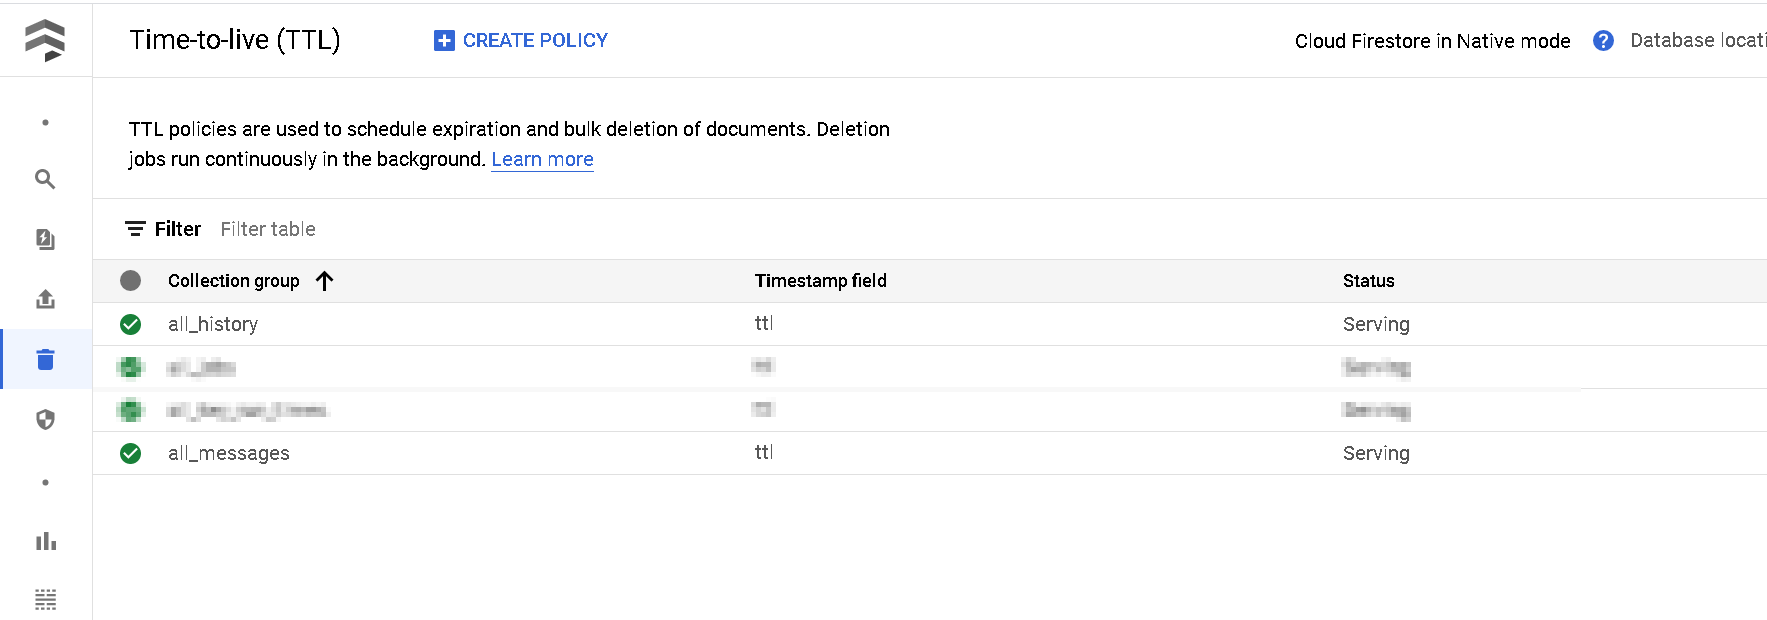
To keep within the free tier of the Firestore storage (which is 1GB per month and it will take our example many months to get there), you can also set Time to Live settings of Firestore.
You can do it like shown in the screenshots below.
Make sure you do this after running the Services Dashboard at least for 1 day.
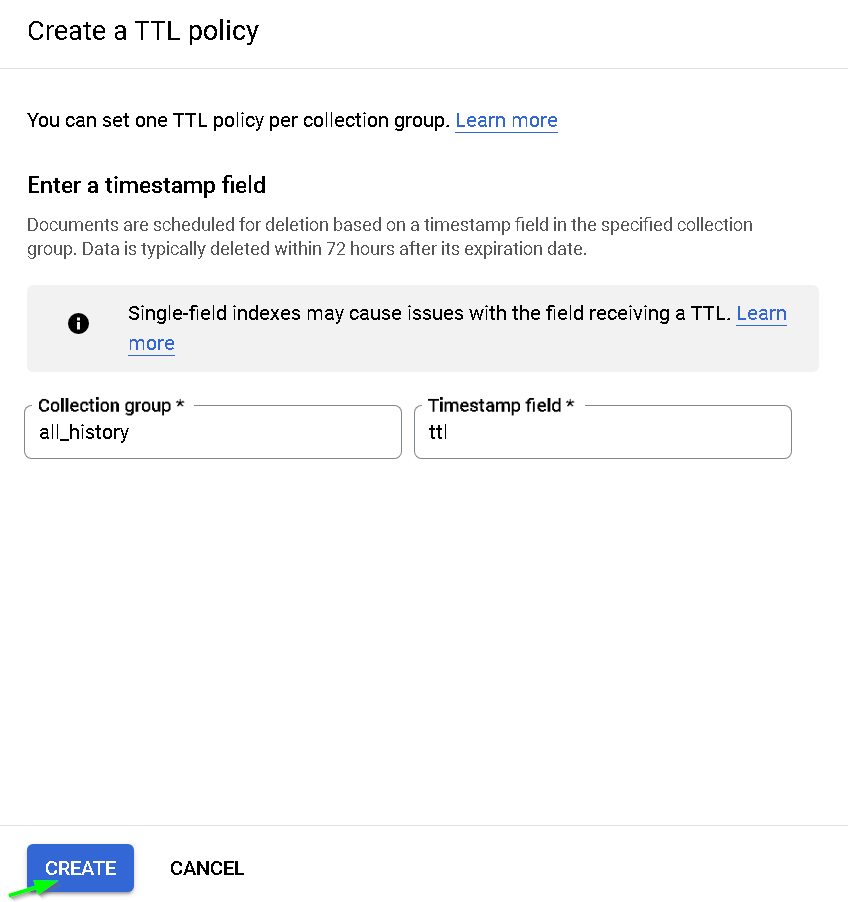
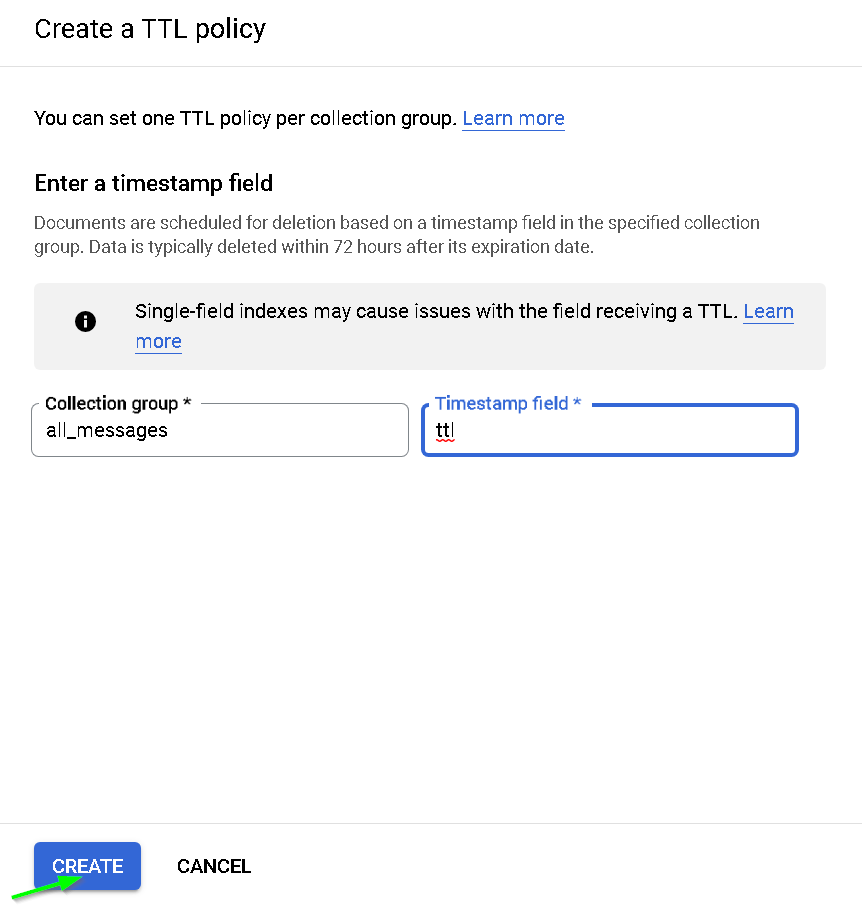
Now Firestore will automatically delete data after retention period is over. Retention period can be changed in the settings page. You can read more about Firestore data retention here
Other than GCP services, the Sendgrid free plan allows you to send 100 emails free in a day. Services Dashboard does not send any sensitive information over email.
11. upgrading to the latest version
You can come here/ github page to find out what is the latest version. The current deployed version is shown on Services Dashboard UI at left bottom.
Current version 1.0
To upgrade to the latest version, you can just follow the same app engine deployment step as the original deployment from the setup steps. This basically involves cloning the main branch and running gcloud app deploy.
12. Improving performance
By default Services Dashboard runs in an F1 instance (default App Engine Instance) with automatic scaling set to 1, but you can change these settings in app.yaml and improve the performance when you add more users / keys.
# app.yaml in default configuration
runtime: python39
service: default
instance_class: F1 # instance_class and max_instances can be adjusted based on usage
automatic_scaling:
  max_instances: 1
env_variables:
  RUNNING_IN_APP_ENGINE: "Y"
  LOG_LEVEL: "warning" # debug for initial deployment but then switch to warning
  PYTZ_TIME_ZONE: "Asia/Kolkata" # pick from all_pytz_timezones.txt based on your tz
Setup steps
Time required ~20 minutes
You can check the video below for setup. And here are the instructions used in that video
# Create new project, enable firestore and open cloud shell as project owner.
git clone https://github.com/nikhilpurwant/services-dashboard.git

cd services-dashboard

gcloud app deploy app-setup.yaml

# optional if you plan to use API endpoint for updating servies statuses
gcloud app deploy api.yaml

# once you setup the admin user, IAP (check video for that)
gcloud app deploy app.yaml
Setup Demo
Please watch in full screen or on YouTube directly
Securing Services Dashboard
When running Services Dashboard as demonstrated in the the setup above - application is already reasonably secured. But you can take additional steps to secure it further
- Access to application is over HTTPs
- Access is through Identity Aware Proxy which takes care of user management. No credential management is required.
- Services Dashboard runs in its own project and hence has a small blast radius
- For App engine - It uses default permissions but you can further improve this as shown below.
- No sensitive information is sent over email when alerted through Sendgrid / Alerting policy
Additional steps you can take
- Only use the Services Dashboard project (separate GCP project) for Services Dashboard application (as shown in the setup)
- Allow only the required people access through the Identity Aware Proxy
- Do not share application URL unless IAP setup is complete
Conclusion
Services dashboard provides a lightweight, feature rich, open-source solution for elegantly showing managed service status and sending notifications to your customers. It can be run in the free tier of GCP.
You can add feature requests in the comments or on Github.
Thank you for reading through, Please like 👍, share 🔗 and comment ✍ if you found it useful.
-Nikhil